Iowa Corn Production and its Affect on The Dead Zone in the Gulf of Mexico

May 5, 2016

Parsons, Sadie

GEOG 490

Dr. Amador

May 5, 2016

Abstract

Agricultural runoff from corn farms in Iowa is believed to contribute to the growing dead zone in the Gulf of Mexico (Beman et al., 2005; Minnesota Center for Environmental Advocacy, 2016). This natural, but mostly human induced phenomenon (Simmon, 2012), also termed a hypoxic (low oxygen) zone, is partially driven by an increase in the demand for food and biofuel production, prompting farmers to have a heavier reliance on phosphorus- and nitrogen-rich fertilizers.  Loose topsoil containing these phosphorus and nitrogen-rich fertilizers are transported into streams during heavy rainfall events (mainly in springtime), travelling through the Mississippi River system and emptying into the Gulf of Mexico. The excess nutrient loading creates massive algae blooms and subsequent hypoxic conditions. The growing number of hypoxic zone events contributes to the range of this dead zone, spanning 6,474 square miles as of August 3, 2015. (Simmon, 2012). These events contribute to massive fish kills which threatens fisheries and a large human food source (Altieri & Gedan, 2014; Bruckner, 2012). Analysis of this urgent manmade problem relates trends in Iowa corn production to the increasing dead zone conditions in the Gulf of Mexico during 2010-2015. To mitigate these effects, this work seeks to better understand our current farming practices and to assess alternative techniques that are believed to be less impactful on the hydrologic environment.

Introduction

Our oceans are dying, and humans play a large role in their current and future health. Agricultural practices are believed to be part of the reason why there is a growing hypoxic or “dead zone” in the marine ecosystem in the Gulf of Mexico. A dead zone is an area in the ocean that cannot support life because of its hypoxic conditions (lacking oxygen) (Simmon, 2012). This particular dead zone in the Gulf spans from the mouth of the Mississippi River covering 6,474 square miles as of August 3, 2015. Nancy Rabalais, the executive director of the Louisiana Universities Marine Consortium (LUMCOM) states, “the Dead Zone off the Louisiana coast is the second largest human-caused coastal hypoxic area in the global ocean.” With our current food and biofuel demands, the dead zone can only spread over more territory. The Gulf of Mexico provides 72% of U.S. harvested shrimp, 68% of harvested oysters, and 16% of commercial fish (Bruckner, 2012). Fisherman, economies, and our food source will be severely threatened even more if this 5,052 square mile dead zone spreads.

This research seeks to analyze corn production in Iowa, which is one of the many states that contributes to agricultural runoff to the Mississippi River. Correlating this data with different rainfall events to different hypoxic events, their intensities, and massive fish/organism kills in the Gulf of Mexico will allow us to understand the amount of human impact on the environment in regards to agricultural practices and its consequences downstream. As a result, we will be able to identify different mitigation strategies to reduce human impact on the environment through different agricultural practices.

Background

In Iowa, corn has been the largest produced crop for almost the last two decades (Iowa Corn Growers Association, 2016). Due to current human demands for food and biofuel, farmers have incorporated Phosphorous and Nitrogen rich fertilizers to their crops. These are the two main nutrients in agricultural runoff that contribute to nutrient loading.

After heavy rainfall events (primarily during the springtime), the increased nutrients, phosphorus (P) and nitrogen (N), in the topsoil are transported into the fluvial system eventually making its way into the Mississippi River. Microscopic plants called phytoplankton thrive as these nutrients become more concentrated in a process known as eutrophication. These are generally seen as algae blooms. After the phytoplankton expend the nutrients, they die and sink to the bottom where bacteria eat them while consuming and depleting the oxygen in the process (Beman et al., 2005; Bruckner, 2012; Rabotyagov et al., 2014; Simmon, 2012)

Different densities of ocean water creates a thermocline, which is the transition layer between warmer and cooler water (NOAA, 2016). here some areas contain no oxygen zone where organisms cannot survive (Beman et al., 2005; Bruckner, 2012; Rabotyagov et al., 2014; Simmon, 2012).Naturally, the tides and waves restock this consumed oxygen from the air and it mixes down to the bottom; however, during the summer months fresh, less dense, warmer surface water sits on top of colder, more saline, denser water and creates a barrier between the two water bodies, therefore limiting the amount of oxygen that can be replenished. This stratification leaves the bottom layer with little to no oxygen that cannot sustain life, called a hypoxic or dead zone (Murray, 2010; Rabotyagov et al., 2014). The Gulf of Mexico, The Chesapeake Bay, Scandinavia’s Kattegat Strait, the mouth of the Baltic Sea, the Black Sea and the northern Adriatic are only a few of the 550 dead zones worldwide, largely influenced by mankind’s impact on their environment in various polluting ways (Simmon, 2012).

Methodology

Data collected included: county-level fertilizers, precipitation events, and the hypoxic area in the Gulf of Mexico. I compared fertilizer usage and precipitation to the extent of the hypoxic area.

Acquisition of the United States Geological Survey (USGS) county-level estimates of Phosphorous and Nitrogen (kg) use (2001-2006) (Figure 2- Figure 7). The values for Nitrogen use on farms range from 0 – 25,000,000 kg, while values for Phosphorus use on farms range from 0 – 5,000,000 kg. Data was aggregated into five categories between these ranges and color coded them by value. The yellow represents lower amounts of Phosphorus and the red represents higher amounts of Phosphorus. Since they had the same values associated with their colors, they were easy to compare throughout the years listed.

Precipitation amount data for statewide ranks were acquired from February to July in 2010 to 2015 from the National Climatic Data Center (NCDC) (Figure 1).

Year Precipitation Wetness Rank Hypoxic Area (mi2)
2010 114/116 2 7,722
2011 87/117 5 6,757
2012 14/118 6 2,896
2013 114/119 1 5,792
2014 103/120 3 5,405
2015 96/121 4 5,405

The data of Hypoxic extent in the Northern Gulf of Mexico were acquired from the Environmental Protection Agency (EPA), which represents the area in square miles of hypoxic conditions (Figure 1).

County-level maps of Iowa displaying Nitrogen and Phosphorus on farms, as well as perennial streams of Iowa were generated using ArcMap (figure 11).

Results & Conclusions

High Phosphorus and Nitrogen levels combined with high precipitation years correlates with different areas (mi2) of hypoxic conditions in the Gulf of Mexico. Due to the time difference of county-level estimates of Nitrogen and Phosphorus use on farms from 2001 to 2006 (Figure 2- Figure 7), and precipitation events from 2010 to 2015 (Figure 8- Figure 10), a direct relationship between the data cannot show a direct linkage to the extent of the hypoxic area in the Gulf. However, according to the literature (e.g., Beman et al., 2005; Bruckner, 2012; Rabotyagov et al., 2014; Simon, 2012), Nitrogen and Phosphorus are the two main nutrients that drive algal blooms and their subsequent hypoxic conditions. Therefore, despite the time gap in data sets, higher amounts of Nitrogen and Phosphorus in addition to more rainfall events are expected to correlate with the extent of hypoxic area (mi2) in the Gulf of Mexico.

Years with more precipitation in Iowa are correlated with higher hypoxic conditions. Years 2010 (Figure 8), 2011 (Figure 9), and 2014 were the three wettest years for Iowa between the 2010 to 2015 study period and all correlate with high hypoxic areas (7,722 mi2, 6,757 mi2, and 5,405 mi2) (Figure 1 & Figure 12). Years with less precipitation in Iowa are correlated with lower hypoxic conditions, such as 2012 with a correlating hypoxic area of 2,896 mi2. This remains true except in 2011 where the Gulf had a hypoxic area of 6,757 mi2. To explain the apparent 2011 anomaly, other surrounding states within the Mississippi River watershed (e.g., Ohio, Louisiana) experienced much above normal precipitation events and record wettest levels of precipitation. Therefore, the presence of additional states in the Mississippi River watershed influence the amount of nutrient transport into the Gulf of Mexico; Iowa is not the only state that contributes nutrients to the dead zone.

Further Work

More precise and current Nitrogen and Phosphorus inputs data for Iowa will help to further understand the influence of agricultural runoff on hypoxic conditions in the Gulf of Mexico. Additionally, a larger set of data from other bordering states around the Mississippi will help fill the gaps between which state(s) are  most influential on nutrient inputs in the Mississippi River watershed and the downstream Gulf of Mexico. This may allow us to identify different agricultural production methods to reduce our impact on the environment.


Works Cited

Altieri, A. H. and Gedan, K. B., 2015. Climate change and dead zones. Global Change Biology. Vol

  1. P 1395- 1406. http onlinelibrary.wiley.com/doi/10.1111/gcb.12754/epdf://.

Beman, J. M. Arrigo, K.R., Matson, P.A. 2005. Agricultural runoff fuels large phytoplankton

blooms in vulnerable areas of the ocean. Nature. 434, 211-214

Bruckner, M. 2012. The Gulf of Mexico Dead Zone. Science Education Resource Center.

http://serc.carleton.edu/microbelife/topics/deadzone/index.html

NOAA. 2016. National Temperature and Precipitation Maps. Statewide Precipitation Ranks

February- July. Department of Commerce. http://www.ncdc.noaa.gov/temp-and-precip/us-maps/6/201507?products[]=statewidepcpnrank.

NOAA. 2015. Ocean Facts. What is a thermocline? National Ocean Service.

http://oceanservice.noaa.gov/facts/thermocline.html

Rabotyagov, S. S., Kling, C. L., Gassman, P. W., Rabalais, N. N., Turner, R. E. 2014. The Economics

of Dead Zones: Causes, Impacts, Policy Challeneges, and a Model of the Gulf of Mexico Hypoxic Zone. Iowa State University. Review of Environmental Economics and Policy. Vol 8, issue 1. P 58-79.

Simmon R. 2012. What Causes Ocean “Dead Zones”?. Scientific American.

http://www.scientificamerican.com/article/ocean-dead-zones/


OWU Campus Sustainability: Water Bottle Project

May 4, 2016

OWU Campus Sustainability: Water Bottle Project

Catie Beach & Jordana McCallen

Summary & Results

As senior BFA’s, we set out to combine our interests of environmental sustainability and art-making, by creating ceramic water bottles that were sold in accordance with Green Week Events. We created unique vessels to combat excessive waste issues on OWU’s campus. The distribution of these products served to both decrease OWU’s paper waste by providing water bottle alternatives, and simultaneously increase the use of the hydration stations. In creating our own alternative, we sought to highlight the preciousness of the objects rendered, as a means to convey the equal preciousness of the water they contain. The bottles were created by utilizing techniques learned within ceramics, as well as other studios. In employing various techniques, we sought to evoke their handmade quality, experienced in the exposed terra cotta. The materials act as a reminder of the origins of the medium, as well as the way we treated the surfaces, evoking the human touch that went into rendering them.

We created fifty bottles in total, which we sold during Green Week, during events that overlapped with our project’s overall aim. Such initiatives included “Ban the Bottle”, and “Carry Your Waste”, both of which sought to educate students on the extent, and impact of the waste they generate. Our efforts proved fruitful, as we received positive reception by many members of the student body. We sought to make the bottles affordable, charging $7 and $10 based on the size and complexity of the technique, which was similarly well received. In the first two days of tabling, we sold over thirty bottles! The money generated will be donated to Water.org, and Stratford Ecological Center. We chose to donate to both charities as the former directly relates directly to our project goals, while the latter is located locally, emphasizing the idea of the buying local, but also affecting change at various levels.


Methods & Results

We employed various methods of construction, including cylindrical and geometric slab forming, as well as wheel thrown bottles. As the name implies, slab forming involved cutting wedges of clay and rolling them through a press to our desired thickness. From there we were able to cut out patterns for geometric slabs, and larger squares which were draped around various cylindrical objects to form their shape. Many of the bottles evidence our process, including parts where we squeezed the forms to create a grip, emphasizing the idea that they’re meant to be held and used. The variation among them is striking, and speaks to our initial concept of really showcasing the preciousness of the craft and the purpose it serves. Wheel thrown bottles require more skill, so Kristina and upper level ceramics students helped us utilize the leftover clay from our slab constructions to create equally unique and varied vessels.

From the outset, we knew we wanted to leave the clay unglazed and exposed to emphasize the medium and evoke the vessel’s organic nature, experienced in both the form and tactility. Both aspects would be continually confronted by the user, and our aim was for these stylistic choices to better convey the meaning behind them.

Our initial concept for bottle decoration was to use image transfers depicting scenes of local urban flora and fauna. The photolithography technique, developed by Kristina Bogdanov, uses xerox copies of images as an alternative to a lithostone, in which the image is traditionally etched into the stone, filled with ink, and transferred onto paper. This interpretation allowed us to transfer original photographs onto the bottles. The photos taken included imagery of plants, fungi, and deer from Columbus, OH. Calling to Cronon’s concepts in “The Problem With Wilderness,” the use of this imagery asks viewers to reconsider what defines beauty in nature. The preciousness and individuality of the bottles enhances the viewer’s interpretation of the imagery on the bottle. While the imagery does not directly align with the greater intent of water resource awareness, its pairing with the bottles’ conceptual function aids the viewer in returning to a personal and local perspective when considering these themes.

Unfortunately, the bottles were not in the proper state of hydration for the transfers to take at the time of decoration. Only four of the bottles held successful transfers, including imagery of deer, crocuses, and erosion patterns. Others held slight impressions of the image. On these bottles we utilized the grey wash as a third tone and used sgraffito, or “scratching” methods to make designs. We painted white slip on the outside of the bottles and scratched beneath to reveal red terra cotta. Through this alternative plan we maintained themes of natural imagery by created organic patterns and washes, but shifted focus onto the aesthetic design of the bottle as a whole.


We chose to donate to water.org early on, as the organization seeks to implement clean water sources around the world. In our initial goal of making students think about the preciousness of water, we thought supporting an organization that seeks to affect change by providing clean water sources to places where that preciousness is acknowledged was appropriate. Additionally, the organization seeks to spread awareness of the ways that people’s lives are affected by limited access to clean water sources. Their website makes it easy for the individual to make an active difference, both monetarily and through service work, directly and indirectly related to the organization. This transnational presence is a source of agency, and in part inspired our decision to donate half of the money generated to Stratford Ecological Center. Being a local entity, we wanted to acknowledge the importance of supporting local and the agency that holds for the individual. Having a more personal understanding of the organization and its mission relates to the topics discussed in our environmental geography class at large.


Funding & Advertizing

At the outset of the water bottle project we sought a mentor, venue, and funds for the project. Considering our workloads and timelines for the semester, we determined Green Week, held April 18-22nd, to be the most appropriate time and venue to sell the water bottles. First, we approached Green Week organizers Reilly Reynolds, Cynthia Hastings, and Ellen Hughes to seek permission in joining their programming. All organizers were eager to host the water bottle sales alongside Green Week tabling and began advertising and adjusting Green Week events appropriately. In turn, we agreed to advertise other Green Week events along with our project.

After establishing our venue we approached the Fine Art Department’s ceramics and drawing professor Kristina Bogdanov for assistance, guidance, and studio hosting through the extent of the project. Professor Bogdanov, who was involved in previous water sustainability-related projects, was eager to mentor us through the project. We settled on her services of “demo-ing” construction techniques, firing the bottles, and hosting us in the ceramics studio in exchange for a $250.00 half day workshop fee.

Finally, we researched different methods of obtaining funds for the project, including Fine Arts Department funds, Geology Department funds, Student Led Art Movement Funds, and Environment and Wildlife funds. We settled on the Small Project Grant funding as the most appropriate resource for supply money. We drafted a proposal in request of funds to persuade SIP reviewers of the campus, personal, and departmental benefits that the water bottle project would create. Our budget included the cost of 100lbs of clay, corks, coffee lids, and clay, totaling $85.00 each. Upon approval the grant committee rounded our total up to $100 each. Soon after receiving the grant we decided to focus on only water bottles for the project and left out coffee lids from the budget. The remaining funds were later used to purchase additional corks for misshapen bottles.

After picking up clay and glaze from Buckeye Ceramics, we began advertising for the event through word of mouth and facebook. We chose facebook as the most appropriate venue of advertisement for its ability to communicate visual information and reach out to people beyond our friends within the OWU community. We created a public event titled “OWU Sustainability: Ceramic Water Bottles” and invited all OWU students on our “friends list”. We began posting and explaining the project to our “followers,” to which many responded by “liking,” “sharing,” and commenting on the event postings.


The act of sharing the construction process served both as an advertizing and connective process with our buyers. Many people said they were able to pinpoint the exact bottle they wanted from the postings. The ability to share this process from start to finish also made our buyers feel as if they were involved in the construction. Although we could not host buyers in the studio to make their own bottles, the visualization of the bottles’ transformation created a deeper connection and appreciation for the product. The students who purchased the bottles during tabling recognized the thought and labor put into these works. They were essentially “sold” on buying a piece before seeing or holding the final product in person. The documentation of these works also contributes to the idea of this project as a type of performance. Through the repeated sharing of an art/philanthropy idea on a social media site focused on the mundane, we intended to break through the noise and return to local. While the viewer scrolls through their feed consuming avocado recipes, dog videos, and Donald Trump articles, the prospect of supporting a local philanthropic event stands out. Not only does the support of this event provide a unique incentive, but stimulates a thought not often discussed on facebook: threats to water resources.

Overall the event was extremely successful. Our water bottles sold out within two days of tabling during lunch at HamWil. The cooperation with Green Week events and tabling stimulated a lot of excitement and conversation with students about sustainability on and off campus. We noticed a number of students using their bottles at the hydration stations and overall were proud of their unique works.

Recommendations

The only mishap we ran into was finding money to pay Kristina a stipend for running the kilns, and assisting us in production. We initially tried to incorporate that cost into our SIP, but we weren’t able to go that route because the money delegated for the fund can’t be used to pay existing faculty. We ran into a similar problem with WCSA when we tried to apply for supplemental funding through E&W, in addition to the fact that we were generating money from selling them, even though it was being donated. Ultimately we were able to cover the cost by using some of the money generated as well as money from the non-WCSA funded SLAM account, which we were able to use because it had been fundraised.

In the future, I think it would be fruitful to get in touch with WCSA earlier on, and really make the point that the format of the project is unconventional — the money given to Kristina was for her labor, not simply overseeing the project.

Contacts

Reilly Reynolds, Green Week Organizer, rjreynol@owu.edu

Kristina Bogdanov, ceramics professor, kkbogdan@owu.edu

John Krygier, faculty advisor, jbkrygie@owu.edu

Darrell Albon, SIP grant coordinator, djalbon@owu.edu


Project Report

May 4, 2016

Being Vegan on OWU Campus

Shannon Schlater, Callan Yanoff, Emily Scott


The goal of this project was to become/be vegan for the semester and work to get more vegan options on campus, not just for vegans, but to allow for less animal-product consumption by all. The new vegans also documented their progression into veganism and the challenges they encountered on a Twitter page (https://twitter.com/readysetvegan). At the end of the project, we collected a list of tips and strategies other students can reference if they want to become vegan at OWU.

Suggestions/Thoughts/Etc. from newbie vegans:

Callan Yanoff:

I had a rough transitioning into veganism because of many reasons, but mostly eggs. I will get into the eggs later, but I will start with points about my religion and past vegetarian experiences. Being Jewish as well as my father being hasidic, we followed some of the rules of kosher eating. That includes limited beef options, no pork, lamb, or goat. I already cut out many sources of meat in my diet, except for constantly eating eggs, some dairy products, and chicken. Dropping chicken was hard, but there are many dishes containing chicken that can also exclude the meat products. As for eggs, ugh. Eggs were an integral part of my diet, being breakfast in the form of omelettes, crumbled on my salads for lunch, and scrambled for dinner. This transition was the hardest, because I usually have heavy workout filled days, and I feel that eggs provide the protein that I need to get through the day. It was hard, but completely do able with vegan protein bars. I enjoyed this transition ultimately, because I felt energized and had a difference in the amount of migraines daily. I suggest cutting some things out in preparation for becoming vegan because cutting it “cold turkey” or “cold tofu” is not an easy task. Cutting out a different animal or animal by product helps with the extreme process, of watching every ingredient that goes into your food. I also have a strong reliance on seafood, whether that be tuna, salmon, or tilapia. I thoroughly missed eating fish and shelled crustaceans, but did not feel any differences because of the difference in diet. If I was completely at home while being vegan and living next to the ocean where seafood is aplenty, I probably would not have been as successful as living in landlocked Ohio.

Emily Scott:

As the other newbie vegan on the team, I had some challenges to overcome when becoming vegan. Before this project, I had no limitations on my diet. I ate around 8 meals with red meat per week,  5 meals with white meat, and seafood maybe once a month. My egg consumption was not as high as Cali’s but I usually had around three eggs a week. I became vegan overnight with no transition phase. During week 1, my main problem was changing my thinking. Before this project, the only thought I gave my meals was in the 5 minutes before I ate to decide where I was going to eat and what I would choose from their multiple options for carnivores. After becoming vegan, I had to, first of all, remember that I could not eat any meals with animal by-products. Then I needed to educate myself on the frequency of animal by-products in meals on campus. I would suggest researching all the foods you are thinking of eating as a vegan before you actually become vegan. I did not, so I made quite a lot of mistakes in the first month of becoming vegan but I learned a lot. After my researching and education phase, I did not have very many options on campus. I started eating less food and not feeling as energetic. I had been taking vitamins since the beginning but this was when I started planning out my meals. I ended up buying a lot of ingredients at Thompson and started making a lot of my meals at home to bring to academic side of campus.

I highly suggest that beginner vegans plan out their meals and make a habit of it from the start. My diet usually consists of veggies and fruits three times a day as well as tofu, hummus, and soup at least five times a week. I found a few prepared meals at Thompson that I really enjoyed: Vegan chicken nuggets and veggie pot stickers. They also have very good muffin bread infused with cranberries and oats that can be used to make a great peanut and jelly sandwich. On academic side, I am usually only able to eat their snack box with hummus or the steamed veggies so I either have to eat light or pack dinner if I am going to be working late in lab.

I think I will continue eating a lot of tofu, veggies, and fruit but I will definitely decrease my hummus and soup intake. I will begin eating red meat again (because I can’t resist) but not white meat, seafood, or eggs. I think I will be able to maintain this lifestyle indefinitely.

Suggestions/Thoughts/ Etc. from veteran vegan:

It took me about a year from a meat/dairy/egg/no restrictions diet to convert  to a complete vegan. I highly suggest this method. I gave up red meat for a couple months, followed by white meat, next was dairy, honey, and any eggs that I didn’t know the chickens they came from, and now I do not eat anything that contains any animal products. This was extremely successful for me, as it allowed me to continue eating certain aspects of my diet through each step while only being forced to cut out one or two things at a time. This allowed me time to not only find other options, but also acquire a taste for a more plant-based diet. I’ve always really liked fruits and vegetables, but now I love them, and can easily eat peppers/cucumbers/etc. plain.

I also suggest if you are having trouble finding adequate options on campus to be extremely persistent. I appealed multiple times to get off the meal plan and while they were very set in not letting that happen they had me work with Dan Magee who then ordered or went to the store and bought any food I wanted. I typically only eat organic produce so he actually went to Meijer and bought me food and deducted meal points from my plan– silly, yes, but it’s better than nothing. You can also request certain items to be stocked in Thomson. The manager, Cheryl, is very accommodating and will try to order in a couple of things. I just suggest you know what Thomson already has as it can be frustrating for her if you list a bunch of things they already have (I’m guilty of this, but I’m also picky and I wanted specific brands).

Last, I really suggest you embrace mistakes. If you get really upset every time you mess up it will be very frustrating. Take them as learning experiences and the fact that you’ll know better next time. Whether you’re perfect or not you’re trying and subsequently making a difference, so be proud of that.

-Whether you like PETA or not, their website is full of great information about vegan options for snacks, eating out, meal ideas, etc. The facebook page Green Monster was also a useful source.

Being vegan on OWU campus:

New Vegans On Twitter:

As part of the project, I created a twitter account (https://twitter.com/readysetvegan) where Callan and I(Emily) posted our journey to veganism. Looking back through the posts, you can see how ignorant I was at the beginning when I accidentally put cream in my coffee and ate food with a cream based sauce on the top or corn prepared with butter. After I stopped eating the obvious meals with animal by-products, you can tell that I started doing nitty gritty research into what my food was made of. One big loss during this phase was the vegetarian sushi rolls that I loved and relied on when on the academic side of campus. I found out that the rice had egg in it and had to give it up. I would not consider myself an expert at telling what food is and isn’t vegan but after this project is over, I aim to continue learning about the origins of the food I eat. I need to be accountable for what I consume and I cannot do that if I am ignorant.

Time-saver tip: Check the allergens first when looking at ingredients. Rather than trying to read through a lot of ingredients or decide if something is vegan or not the allergens section will immediately tell you if there is dairy/eggs in it. This way you can put a non-vegan item down immediately. However, if it appears vegan then go back through all the ingredients to ensure something that wouldn’t be considered an allergen, like gelatin, is not in it as well.

-Ask if you are unsure. It takes much less time to talk with the people making the actual food, and not guess about the ingredients. If you think it has dairy in it, it probably does.

Smith:

Rice cookers and salad bar are good options

Peanut butter, jelly, bread, most cereals (google them to know for sure), soy milk are all vegan

Steamed vegetables

Hummus is supplied at the sandwich station near the pizza; just ask for a scoop

The oatmeal on weekends at breakfast is completely dairy free. And tasty!

All cookies out in Smith are vegan (only the cookies, not brownies or other desserts like that)

Be careful, these things are NOT vegan even though you might think they are:

Vegetables covered in sauces are often not vegan

Soups are often not vegan even if they’re veggie. Check if there’s cream/dairy in them

Soups are made with chicken or beef broth; don’t be fooled

They hide cheese in many vegetables and potatoes; IT’S A TRAP

Hamwil:

Veggie snack boxes

Salad bar has stepped up it’s game–many raw vegetables to snack on.

Vegetable soup (I’m pretty sure the vegetarian chili is not vegan, but the soup is)

There’s always bread and peanut butter available

Soy milk

Odwalla granola bars are filling and inexpensive

Odwalla drinks (with the exception of the protein enhanced ones)

Be careful, these things are NOT vegan even though you might think they are:

Veggie Sushi: eggs in the rice and the dressing is not vegan

Vegetables on the right side are usually coated in butter even if you don’t see it


Thomson:

Dark chocolate

Skinny pop popcorn

Ben and Jerry’s Dairy free ice cream

Fake chicken

Veggie Vegan Pot Stickers

Squash soup

Amy’s dinners-check ingredients, some are vegan and some are vegetarian

Pea protein powder

Airheads, jolly ranchers, pixy stix, sour patch kids, Swedish fish, nerds, gobstoppers, smarties, most suckers.

Rice, black beans, corn, steamed vegetables, nuts

Ketchup, mustard

Be careful, these things are NOT vegan even though you might think they are:

Vitamins (Gelatin capsules)- alternatives can be found at other stores such as MegaFood Vegan Daily multi-vitamins (gelatin)

Sour punch straws

Protein advertised products (drinks)

Orange juice (or anything for that matter) that are omega enhanced (comes from fish)

It’s easy to forget about honey- honey nut cheerios are not vegan

Mayonnaise (Dining halls have vegan mayo, but the stuff in T-store is not)

Off Campus:

Chipotle: The sofritas are actually delicious. 1. Sofritas, beans (pinto or black), rice (white or brown), fajita vegetables (made with green peppers, red onions, salt, oregano, and rice bran oil), guacamole, chips and salsa. Sofritas actually taste very similar to the chicken at Chipotle, so it feels as if you are not giving up anything. Sometimes they do not have the tofu though, and there is only the option to get the vegetarian bowl.

Taco Bell is surprisingly one of the best fast food places to find vegan options. Bean Burrito (without cheese), Bean Tostada (without cheese), Mexican Rice (without cheese), Seven Layer Burrito (no sour cream, no cheese), Hot/Mild/Fire Sauce, Fiesta Salsa, Red Sauce, Soft Tortillas, Pizza Sauce, Green Sauce, Guacamole, and taco shells.

Pure and Simple Health Food Store: Located on Winter Street. They have chicken ($4/dozen) and duck eggs ($6/dozen). The woman that owns the place owns the ducks and chickens and always told me stories about them when I went in. While they’re not vegan, they’re a good option for a more cruelty-free diet and can be a guilt-free animal product you can eat if you’re transitioning.

Supplements:

Iron pill- take with some source of vitamin C to ensure it’s absorbed.

I don’t suggest calcium supplements. If you research them more you’ll find they probably aren’t too good for you based on the way they are absorbed. (Eating Animals touches on this a little bit too)

As I mentioned previously most vitamins aren’t vegan (gelatin capsules). MegaFood Vegan Daily multi-vitamin is what I take. They’re kind of expensive, I haven’t tried getting them in Thomson, but that would be helpful.

Vitamin D has given me more energy, especially since I routinely take it during the winter. I now see a difference now that I do not have animal protein giving me energy, I feel a complete difference based on my diet.

Sample meal ideas:

Breakfast: Bagel/bread with peanut butter and jelly, or various cereals such as plain cheerios, raisin bran, panda puffs, special k, etc. with almond/soy/coconut milk. Side of fruit. Tofu scrambles with tomato, spinach and mushrooms. Roasted portobello mushrooms on whole wheat english muffins. Coffee with almond milk and non-dairy additives such as caramel or creme brulee. (both vegan options)

Lunch: Rice, black beans, steamed vegetables, avocado (all can be bought at Thomson). You could also have a pepper, tomato, cucumber, sandwich with hummus. Roasted vegetables, especially carrots, Vegan chili, tabbouleh and quinoa with vegetables and any kind of vingear, butternut squash, sweet potatoes

Dinner: fake chicken from Thomson or main vegan entrée in Hamwil with various sides such as steamed vegetables or a baked potato (make sure there’s no butter or sour cream.) Veggie burgers with chickpea or split pea soup

Contact information:

Dan Magee- Chartwells worker in Hamwil: djmagee@owu.edu

Cheryl Marcum- Thomson store manager: cmmarcum@owu.edu

Del Sroufe- Chef that has worked with OWU before: http://chefdelsroufe.com, chefdelsroufe@gmail.com

Shannon Schlater- “veteran vegan” of the project: smschlat@owu.edu

Emily Scott- “newbie vegan” : emscott@owu.edu

Callan Yanoff- “egg enthusiast and newly vegan” : cjyanoff@owu.edu, (301) 356-6822


Project Report: Film Screening

May 4, 2016

Film Screening: Last Call at the Oasis

May 4, 2016
Larynn Cutshaw

Summary

Education is key for change concerning any social issue. Environmental education, specifically, can be particularly impactful as it can raise awareness and instill behavioral changes. With this in mind, I decided to use Green Week as a platform to raise awareness for an issue that I see as one of the most relevant of 2016 – freshwater conservation. My interest in this issue came from a zoology seminar at OWU; “Freshwater.” However, my passion for the issue came later after watching the film Last Call at the Oasis. In less than two hours, this film explained every issue we talked about in the semester-long seminar, but did so in a fresh, exciting way. I felt not only more educated but more motivated to change myself and inspire others to make change. I wanted to share this film with others and hope that they would be impacted in the same way I was.

Aside from personal interest, I also chose to hold a film screening for logistical reasons. I knew I wanted to reach the maximum number of people as possible – many more than could be reached by tabling or fliers. I also knew that I wanted to appeal to a wide audience both at OWU and the Delaware community, making me hesitant to consider a lecture or speaker. It is proven that film is one of the most effective educational tool for adults because the visual effects enhance cognitive understanding. Overall, film is the right balance of appeal and excitement that could reach the largest number of people and be the most impactful.

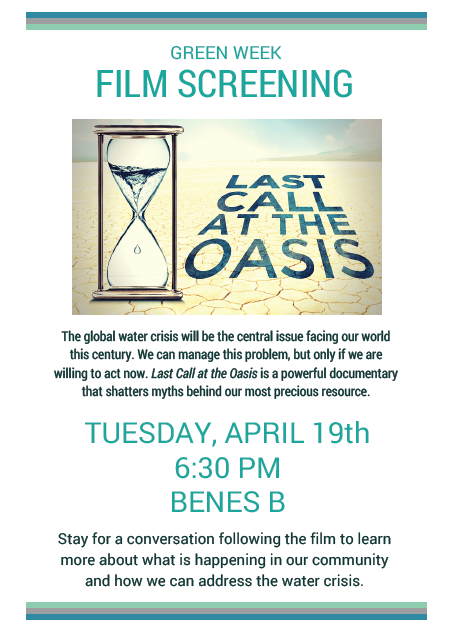
I was able to screen Last Call at the Oasis on April 19, 2016 as part of “Water Waste Day” during Green Week. Following the event, there was an exciting panel discussion featuring local experts in water conservation and management. Afterward, I performed an informal poll to gauge the impacts of the film and discussion on the audience. The results and a how-to guide to hosting an event like this can be found below.

Methods (A How-To Guide)

Below is a step-by-step guide to hosting a film screening and proceeding panel discussion. More detailed information for each contact can be found below.

I. Choosing a location and making reservations

First, one must choose the venue for the event so the appropriate licensing can be applied for. The two categories of the event would be a community screening or university screening. A community screening would be held at The Strand where the university screening could be held anywhere on OWU campus. The steps for each are outlined below.

A. Community Screening

  1. See licensing requirements in Part IIA.
  2. Contact Tracey PeytonB at The Strand for booking.

Note: When I contacted The Strand, they were already booked. I have no information on additional procedures or costs associated with having The Strand as the host venue.

B. University Screening

  1. See licensing requirements in Part IIB.
  2. Choose a location that will be accessible to students and community members and have the space for such an event. I recommend Merrick or Benes B. Things to consider: Is Merrick is as easily accessible to the community as Benes? Are there any concurrent events in Benes A and C that would be disrupted by the noise and lights* of the movie? (*If there are other events in neighboring Benes Rooms, contact Housekeeping to split the lights or you will turn off the lights on other events… awkward.)
  3. Submit an event request via Ad Astra.
  4. Reserve A/V equipment with Chuck Della LanaC [DVD player, projector, projection screen, microphones ([at least one wireless mic for audience questions)].
  5. Reserve table and chair set up through Christina CastleD (chairs and a table large enough to seat the panel and 125 chairs for the audience).
  6. Contact Chartwells for a table cloth and water for the panelists.

II. Licensing

The appropriate licensing entity will vary by the title of film and respective copyright holders. For Last Call at the Oasis, the following companies were contact.

A. Tugg, Inc.E (Community Screening Event)
Tugg would have been the appropriate company if the film was being held at The Strand.

B. Swank Motion Pictures, Inc.F (University Screening Event)

After a lot of back-and-forth between companies, Swank was the best fit for the event I was wanting to hold.

III. Funding

Cost of the event will depend on many factors including: film title, licensing company, location of venue, anticipated attendance, admission fees, and if you already hold a DVD copy of the film (shipping and rental fees through the company will accrue if you do not). For this event with the following details, the cost was $250:

  1. Film Title: Last Call at the Oasis
  2. Licensing Company: Swank Motion Pictures, Inc.
  3. Location: Ohio Wesleyan University, Hamilton-Williams Campus Center – Benes B
  4. Anticipated attendance: 50
  5. Admission Fee: Free
  6. DVD copy (add $28 if no): Yes

Priority source of funding should be through Wesleyan Council on Student Affairs (WCSA) but will need to be submitted with the Green Week Supplemental Budget Request, which will take foresight and planning early on. Next, if WCSA funding is unavailable or denied, a Student Individualized Project (SIP) Grant should be applied for through the OWU Connection. In the case of this event, WCSA funding was denied with not enough time to process a SIP so funds from the Environmental Studies Department budget were used, which was not ideal and should only be used if all other options are exhausted.

IV: Panel Discussion

The purpose of a panel discussion is to provide space for an open dialogue about the issues presented in the film. Additionally, it will allow the audience to seek answers to their questions. An ideal panel will have diversity among fields to allow for various points and alternative viewpoints from the film and each other.

A. Contacts

For this discussion, I contacted the following five people. The first three were able to participate. The fourth agreed but was unable to make it on time for emergency circumstances. The fifth had other obligations for that time.

  1. Amy DowningG (OWU Department of Zoology, Freshwater Ecologist)
  2. Thomas WolberH (OWU Department of Modern Foreign Languages, OWU Sustainability Task Force)
  3. Tom HinsonI (Delaware Water Plant Manager)
  4. Elissa YoderJ (Ohio Sierra Club, Conservation Coordinator on the Clean Water Campaign for Central Ohio)
  5. Kristin PiperK (Delaware Watershed Coordinator)

B. Preparation

For a panel discussion, there needs to by a moderator. You can either moderate yourself or find someone to be the moderator. For this event, I was the moderator. I prepared introductions and questions for each panelist, as well as general questions for each of them. This portion lasted about 40 minutes; the remainder of the hour was filled with audience Q&A.

V. Advertising

Once all of the above are in place, you can begin advertising the film. I used the following resources:

  1. Posters (see appendix for poster); fill out online submission to Duplicating.
  2. OWU Daily Submission Portal (found at the top of the OWU Daily).
  3. Facebook Event
  4. Sustainable Delaware Facebook Group – request access and make a post
  5. Cole HatcherL: send information to Cole and he will forward it to the Delaware Gazette and other local media outlets.

VI. Informal Poll

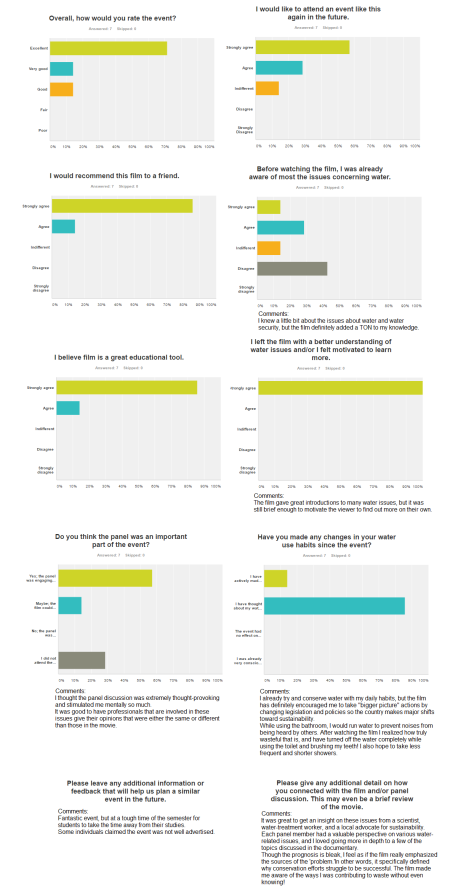
I used Survey Monkey to create a quick, informal poll to send to attendees to gauge their feelings about the event to a) get feedback on what changes to make for similar events in the future, and b) gage the impact the film had on the audience. The survey was completely anonymous. The questions I asked are below (each had multiple choice responses and a comment box for additional information):

  1. Overall, how would you rate the event?
  2. I would like to attend an event like this again in the future.
  3. I would recommend this film to a friend.
  4. Before watching the film, I was already aware of most of the issues concerning water.
  5. I believe film is a great educational tool.
  6. I left the film with a better understanding of water issues and/or felt motivated to learn more.
  7. Do you think the panel was an important part of the event?
  8. Have you made any changes in your water use habits since the event? (If so please describe).
  9. Please leave any additional information or feedback that will help us plan a similar event in the future.
  10. Please give any additional detail on how you connected with the film and/or panel discussion. This may even be a brief review of the movie.

Results (and Reflection)

At first, I was disappointed in the low attendance of the event. With only 11 total attendance (+myself and panelists) I was upset that I didn’t reach the level of impact that I envisioned. However, following the panel discussion and conversations after the event, I felt proud in this event. Before even taking the survey, I had overwhelmingly positive feedback. These comments weren’t just about whether or not the film was enjoyed, but how an audience member was touched or motivated to do more for water conservation. When reviewing the survey results, I found that every person a) said they felt motivated to learn more; b) either second-thought their water use or made active changes to their lifestyle; and c) were engaged in the film and panel and had an overall positive experience. The fact that this film impacted the audience (even if it was small) so greatly by provoking thoughts and sparking conversations, I deem this event a success. In the future, I would like to find a way to reach a wider audience for a similar event.

Recommendations

Timing is key to an event like this. Most of the problems associated with the event was due to poor timing. Every part of planning this event is successional: funding needs to be secured before reservations can be made; reservations must be made before licensing can be applied for (then more funding may be needed); licensing and reservations should be confirmed before reaching out to panel contacts; and finally, contacts and all of the above need to be finalized before you can start advertising. In this case, it took an unexpectedly long time to secure funding and therefore made all the timing skewed. Advertising couldn’t happen until only a week before the event, which likely contributed to the low attendance. Another issue with timing was the time of the year. Although it was best to have it during Green Week, an event so close to finals is almost guaranteed to have limited attendance. With all of the above in mind, I would make the following two recommendations:

  1. Seek funding and begin the processes as soon as possible – it’s never too early.
  2. Choose a time of day and year that students will be most available to attend such a long event.

Contacts

A. Cynthia Hastings
Green Week Organizer
chhastin@owu.edu

B. Tracey Peyton
The Strand, Managing Director
strandmail@aol.com

C. Chuck Della Lana
OWU Media Center
cndellal@owu.edu

D. Christina Castle
Aramark/Event Setup
cncastle@owu.edu

E. Shani Phillips
Tugg, Inc.
support@tugginc.com

F. Maura McKernan
Swank Motion Pictures, Inc.
mmckernan@swankkmp.com

G. Amy Downing
OWU Department of Zoology
aldownin@owu.edu

H. Thomas Wolber
OWU Department of Modern Foreign Languages
tkwolber@owu.edu

I. Tom Hinson
Delaware Water Plant
thinson@delawareohio.net

J. Elissa Yoder
Ohio Sierra Club
elissa.yoder@sierraclub.org

K. Kristin Piper
Upper Olentangy Watershed

kpiper@delawareohio.net

L. Cole Hatcher
Director, Media & Community Relations OWU
cehatche@owu.edu

Appendix

  1. Poster used for advertisement

poster

2. Results from the survey

allresults


Lonnie Barnes – Final Report

May 4, 2016

Urban Heat Island Mitigation: Comparing Strategies?

Urban Heat Islands: Why They Exist and Their Implications

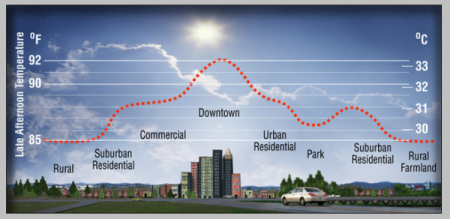
Urban Heat Island Effect

Figure 1. Variation in UHI Intensity in different areas of a city. Source.

The world’s population is becoming ever more concentrated in cities. In 1960, only one third of the world lived in an urban area. By 2014, fifty-four percent of the seven billion people on Earth were city dwellers. By 2050, the UN expects that over six billion will inhabit the world’s cities (United Nations). With such projections, it is important to understand and examine urban conditions and to understand how they may affect our health.

One of the conditions that are unique to cities is elevated temperatures. These areas are called urban heat islands, and are caused by a number of factors. Firstly, the land cover of urban areas (buildings, roads etc.) tends to be darker in color, meaning that more solar radiation is absorbed by these surfaces. They warm and heat up the surrounding areas. Secondly, the geometry of downtown areas (high-rises, skyscrapers etc.) reflects the sun’s rays around, causing an even higher rate of absorption. Thirdly, cities typically have a higher concentration of pollutants, including cars and factories, which put greenhouse gases into the surrounding atmosphere. These gases help to trap any reflected and emitted radiation in the area. Lastly, a generally lower concentration of vegetation in cities means that less of the CO2 that is put into the environment can be used for photosynthesis.

With the right weather conditions (clear skies and stable atmosphere), these factors can combine to create a difference of up to 18˚F relative to surrounding rural areas (Shepherd, 2010). Additionally, heat waves are generally more intense—especially at night, when urban areas cool more slowly—and last longer as a result (Shepherd). A notable example of this was the 1995 heat wave in Chicago, during which over 700 people died from heat-related causes in less than a week. Additionally, heat islands have negative implications for air quality as well as energy and water consumption.

Overview of Mitigation Strategies

As awareness of the UHI effect has become more widespread, cities across the globe have begun to take measures to reduce the severity of their heat islands. The most common strategies are quite simple, and involve finding ways to stop urban surfaces from storing heat or finding ways to deal with the release of CO2 into the environment.

Cool Roofs

Cool roofs are built form materials that have a high albedo as well as a high rate of thermal emittance. The latter allows the buildings to release some of the heat stored inside. In warm climates, such as around the Mediterranean, roofs have commonly been made of white mortar or plaster as far back as ancient times.

Green Roofs

ChicagoGreenRoof.jpg

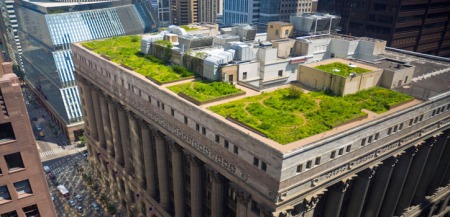
Figure 2. Green roof atop City Hall in Chicago. Source.

Green roofs are similar to cool roofs, but instead of reflecting solar radiation, these plants use it for photosynthesis, and that energy is released through evapotranspiration. They also help to improve air quality—CO2 for photosynthesis—which, as mentioned above, can be negatively affected by the higher concentration of pollutants in these areas.  Green roofs also help to lower the internal temperature of the buildings on which they sit, and can therefore reduce energy consumption.

Increased Vegetation and Trees

Perhaps the most simple mitigation strategy is to increase the amount of vegetation on the surface of these urban environments. Unfortunately, since many cities are so densely built—especially in the downtown areas, where temperatures are typically highest—it can be tough to find enough space to plant a group of trees or for a small park. Trees may also eventually have negative consequences for integral parts of urban infrastructure, such as underground pipes, which can be damaged by roots as trees continue to grow.

Increased vegetation at the surface provides the same benefits as green roofs—helping to cool buildings and improving air quality—while also improving water quality through reduced runoff, and can also preserve the life of pavements by cooling offering shade during the day.

Green/Cool Parking Lots

Many urban parking lots are covered by asphalt with limited vegetative cover, and so another strategy to mitigate elevated temperatures is to cover these parking lots with grass and trees or to use materials with a higher albedo. These parking lots cover about 10% of the surface in American cities, so they can certainly be a significant contributor to the warming of the area (Onishi 2010).

Factors to Consider For Strategy Implementation

While many cities have similar spatial patterns, none are exactly the same, and this has consequences for each city’s heat island. As Debbage and Shepherd have shown, the contiguity of a city is an important factor in determining the intensity of its heat island (2015). The density of a city is not as important as its contiguity; however it is more difficult to find space for vegetation in high-intensity urban areas, therefore making it more difficult to implement certain mitigation strategies. The distribution and location of its largest buildings also matters—skyscrapers close to the coast in Miami, for example, likely obstruct the cool breeze coming in from the sea (Debbage and Shepherd, 2015).

Another factor to take into account is the climate of a city. In arid climates, green roofs and/or increased vegetation may not be as viable an option as cool roofs; the amount of water used to maintain these plants could outweigh the benefit of having them. In wet climates, however, strategies involving vegetation—green roofs, trees, or parks—may be the better choice. There is also the possibility that a city is prone to extreme weather events, such as heat waves. In Atlanta, for example, there were 22 heat waves between 1984 and 2007, with an average length longer than 14 days (Shepherd, 2014).

Results & Analysis

Green and Cool Roofs

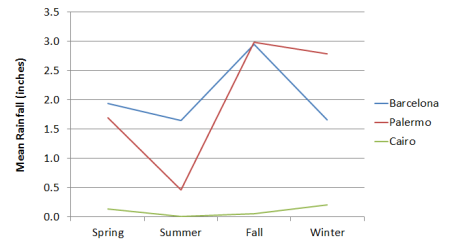
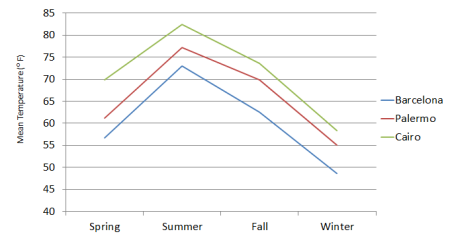
A study done by Zinzi and Agnoli examined the effects that green and cool roofs had on energy consumption in three Mediterranean cities with differing climates—Barcelona, Palermo and Cairo. The study was done for an entire year, so as to account for the various seasonal characteristics of each city (see Figures 3 and 4).

The energy consumption was measured relative to the amount used in houses that had standard roofing.

BCPRain.png


Figure 4. Mean rainfall by season in Barcelona, Palermo and Cairo (Zinzi & Agnoli 2012).

BCPTemp

Figure 3. Mean Temperature by season in Barcelona, Palermo and Cairo (Zinzi & Agnoli 2012).

The results certainly give some insight into the effectiveness of these two mitigation strategies (see Table 1). In the hottest, driest climate of the three (Cairo), the standard cool roofs were the most effective. But in Barcelona, the city with the most seasonal variation, the cool roofs actually caused an increase in energy use, the vast majority of which was used for heating. This indicates that the roofs were doing what they were supposed to—keeping the house cool—but this actually became counterproductive due to the climate in Barcelona. The low-emission cool roofs produced the most consistent results, regardless of climate.

These results indicate that cool roofs work well in areas where it is relatively hot and dry year round, while low-emission cool roofs and green roofs would work better in climates that have more variation from season to season.

This study focused solely on energy consumption, which does depend on the temperature within the house, but now we will look at a study showing how green roofs affect temperature both inside and outside of a building.

Row (%) Detached (%) Mean (%)
Palermo 3.2 3.8 3.5
Green Barcelona 6.2 7.8 7
Roof Cairo 2 2.8 2.4
Palermo 14.9 16.7 15.8
Cool Barcelona -5.3 -5.4 -5.4
Roof Cairo 32 29 30.5
Low-emission Palermo 9 9.7 9.4
cool roof Barcelona 6.8 4 5.2
Cairo 11.5 10.9 11.2

Table 1. Energy consumption results by roof type for Barcelona, Palermo and Cairo (Zinzi & Agnoli 2012).


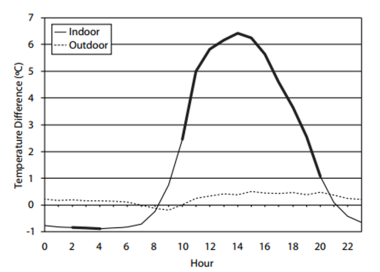
This next study was done by Pompeii II & Hawkins using two scaled building models—one with a green roof and one with a standard roof—during the course of the summer months in Pennsylvania (2011). The averaged results of the study are shown in Figure 5.

As we can see, the green roof had a significant effect on the in-building temperature, especially during the warmest hours of the day. It did not, however, have as much of an impact on the outside temperature. Interestingly, the green roof also caused the building to be warmer during the night.

GreenRoofModel.png


Figure 5. Average indoor and outdoor temperature in the study done by Pompeii II & Hawkins (2011).

Parks

That urban parks are generally cooler than their surroundings is well known, but not as much may be known about the cooling effects that they have on their surroundings.

Nagoya.png

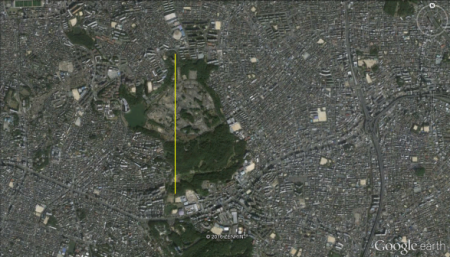
Figure 6. Google Earth image of the park in Nagoya. For reference, the yellow line is just over a mile long.

A study was done by Hamada & Ohta in Nagoya, Japan, a city of almost ten million people. They examined the cooling effects of a large urban park (147 ha) on its surrounding areas over the course of a year (see Figure 6). What they found was that the park had a cooling effect at up to almost 500 yards, and 300 at night (of course, the cooling effects decrease with distance from the park). They also concluded that the most effective way to mitigate increased urban heat was to have small, scattered green areas throughout the city, rather than a few large ones. This is because regardless of its size, each park can only cool up to a few hundred yards around it.

Lisbon.png

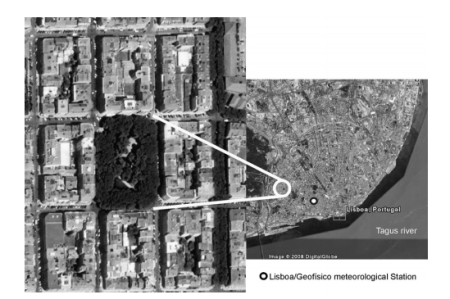
Figure 7. The park in Lisbon (Oliveira, Andrade & Vaz 2011).

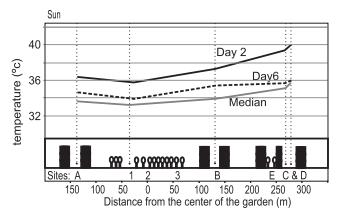
Another study was done on a much smaller park in Lisbon, Portugal. In contrast to the park in Nagoya, this one is only about the size of a block (see Figure 7). Despite its much smaller size, the park had a cooling effect at almost the same distance as the park in Nagoya (see Figure 8). Similarly, they concluded that having many small green areas was the best way to reduce the ambient temperature.

LisbonMeasurement.png

Figure 8. Temperature vs. distance from the park in Lisbon (Oliveira, Andrade & Vaz 2011).

Bodies of Water

Another possibly effective mitigation strategy is to introduce bodies of water. Because of its high specific heat, water can absorb large amounts of energy without much warming. In fact, it is estimated that a body of water with surface area of 20 square yards can cool an area of 3700 cubic yards by almost 2 ⁰F. Of course, since cities are generally densely packed areas, finding the space for large bodies of water would be difficult. Introducing them in already-existing parks, however, could be a viable strategy, and would help to increase the cooling effect that the parks already have.

Conclusion

After look at all of these studies, it seems that small parks are the most effective—and most widely applicable—mitigation strategy. While roof strategies seem to be viable options too, they are more climate-dependent. Of course, parks are contingent on there being the space for them to be put in, but as cities continue to expand, it may be more realistic to implement in the new spaces as they grow outward. Furthermore, introducing bodies of water in already-existing parks—as well as new ones—could help to lower temperatures even more.

Bibliography

Zinzi, M., & Agnoli, S. (2012). Cool and green roofs. an energy and comfort comparison between passive cooling and mitigation urban heat island techniques for residential buildings in the Mediterranean region. Energy and Buildings, 55, 66-76. doi:10.1016/j.enbuild.2011.09.024

William C Pompeii II, & Hawkins, T. W. (2011). Assessing the impact of green roofs on urban heat island mitigation: A hardware scale modeling approach. The Geographical Bulletin, 52(1), 52.

Magliocco, A., & Perini, K. (2014). Urban environment and vegetation: Comfort and urban heat island mitigation. Techne : Journal of Technology for Architecture and Environment, (8), 155-162. doi:10.13128/Techne-15070

Hamada, S., & Ohta, T. (2010). Seasonal variations in the cooling effect of urban green areas on surrounding urban areas. Urban Forestry & Urban Greening, 9(1), 15-24. doi:10.1016/j.ufug.2009.10.002

Oliveira, S., Andrade, H., & Vaz, T. (2011). The cooling effect of green spaces as a contribution to the mitigation of urban heat: A case study in Lisbon. Building and Environment, 46(11), 2186-2194. doi:10.1016/j.buildenv.2011.04.034

Qiu, Guo-Yu et al. (2013). Effects of evapotranspiration on mitigation of urban temperature by vegetation and urban agriculture. [Effects of Evapotranspiration on Mitigation of Urban Temperature by Vegetation and Urban Agriculture] 农业科学学报:英文版, 12(8), 1307-1315. doi:10.1016/S2095-3119(13)60543-2

Rowe, D. B. (2011). Green roofs as a means of pollution abatement. Environmental Pollution, 159(8), 2100-2110. doi:10.1016/j.envpol.2010.10.029

Zhou, Y., & Shepherd, J. M. (2010). Atlanta’s urban heat island under extreme heat conditions and potential mitigation strategies. Natural Hazards, 52(3), 639-668. doi:10.1007/s11069-009-9406-z

United Nations (2015). World Population Prospects: Key Findings & Advance Tables. New York, NY: United Nations.


Digital Portfolio – Emily Scott

May 4, 2016

Week 1: First meeting

Week 2: Current event, Personal Introduction, Project post, and Meadowlands

Week 3: Current event, Project post, Garbage matters

Week 4: Current event, Project post, Dessert Solitaire

Week 5: Current event, Project post, The Fanaticism of the Apocalypse 

Week 6: Current event  & Project Proposal

Week 7: Current event, Nature (Coates)

Week 8: Current event, Eating Animals

Week 9: Spring Break

Week 10: Class Dinner, Current event

Week 11: No meeting

Week 12: Current Event & Environment and Society

Week 13: Current event & Placing Animals


Week 14: Current event & GARBOLOGY PRESENTATION (with Catie Beach)


Jordana McCallen: Digital Portfolio

May 4, 2016

Other Project Updates:


“Garbology”

May 4, 2016

hoarders: common occurrence, sensationalized in the media

  • 3-6 million Americans afflicted
  • 1100 graves of garbage filled by each American — much more lasting legacy
  • 50% more garbage than western countries

Rely on equations/simulations to account for trash, which really touched on Sarah Moore’s account of how little we actually know about where our trash goes, speaks to the idea of how we culturally dissociate from it once it becomes waste.

  • twice as much waste as EPA accounts for
  • waste we produce as consumers/individuals vs. waste within industries
    • Zhang Yin, cultural associations with waste, one mans trash another mans treasure

problem, investigation, solution

  • waste vs. wastefulness
  • p. 15: recapturing value, not so simple with cultural norms/reactions
    • seeing value would be lowly
    • 25% of food supply
      • when things were “made right”, back in the day, how did we switch over to increasingly wasteful/disposable ways

PLASTICIZATION OF AMERICA: change occurring increasingly fast

  • new breed of super consumers: buying useless shit = patriotism
    • Bush’s speech post 9/11, go out and buy things, support the economy
  • law of thrift: depression, all time low

ch. 1: intro, describing through ambiguous lens, authors way of reframing, but also speaks to necessity of context

  • landfill, implies actually filling land

ch. 2: irony in wetlands, early 20th century —> now

  • don’t take enough overt responsibility for our actions, what happens to it?
    • begins chain reaction of sending it further and further away, speaks to exchanges between first and third world countries
  • makes me question the problems in terms of whether people were meant to live so densely populated, with wealth comes excess…
    • p. 45, 46: instinct to recycle, government function to keep the streets clean and garbage away
    • p. 52: trash burning, L.A. air quality predated car-culture
      • establishing fault on the individual, rather than collective, even though it caused significant more harm than an industrial facility


Larynn Cutshaw: Digital Portfolio

May 4, 2016


Readings:

W J 13: First class meeting, no reading assigned

W J 20: The Meadowlands (Sullivan)

W J 27: Garbage Matters (Moore)

W F 3: Desert Solitaire (Abbey)

W F 10: The Fanaticism of the Apocalypse (Bruckner)

W F 17: Nature Part I (Coates)

W F 24: Nature Part II (Coates)

W M 2: Eating Animals (Foer)

W M 9: Spring Break

W M 16: No readings assigned

W M 23: No class meeting

W M 30: Environment and Society (Robbins)

W A 6: Placing Animals (Urbanik) [Presenter]

W A 13: Garbology (Humes)

W A 20: Presentations – no readings

W A 27: Presentations – no readings


Current Events:

W J 13: First class meeting, no current event

W J 20: Ocean Clean Up

W J 27: Moore Lecture – no current event

W F 3: Plastic Bottles for Sustainable Construction

W F 10: Impacts of Seafood

W F 17: Sustainable Seafood Week in the Philippines 

W F 24: Devil of a Disease

W M 2: Puget Sound Storm Water Management

W M 9: Spring Break

W M 16: Best Eco-Inventions of 2015

W M 23: No class meeting – no current event

W M 30: Cuba Ecotourism

W A 6: Cane Toads

W A 13: Pick Up America

W A 20: Presentations – no current event

W A 27: Presentations – no current event

Other:

W J 20: Personal Introduction

W J 20: Project Proposals

W J 27: Project Update I

W F 3: Project Update II

W F 17: Project Proposal

W F 24: Project Update III

W M 16: Project Update IV

W M 30: Project Update V

W A 13: Project Update VI

W A 27: Project Presentation (Link to Prezi)

W M 4: Project Report 


Digital Portfolio Dixon

May 4, 2016

The Meadowlands

Garbage Matters Article

Desert Solitaire

The Fantacism of the Apocalypse

Project proposal

Nature 1 & 2

Eating Animals

Environment and Society

Garbology

Placing Animals


Current Events:

Week 1 = first class meeting

Week 2

Week 3

Week 4

Week 5

Week 6

Week 7

Week 8

Week 9 = Spring Break

Week 10 = Dinner at your house

Week 11 = no class

Week 12

Week 13

Week 14

Week 15= Presentations. No current event discussion

Week 16= Presentations. No current even discussion